

The poster children for this topic are the microbes found in deep subsurface sediments that have been buried for millions of years, the Intraterrestrials.
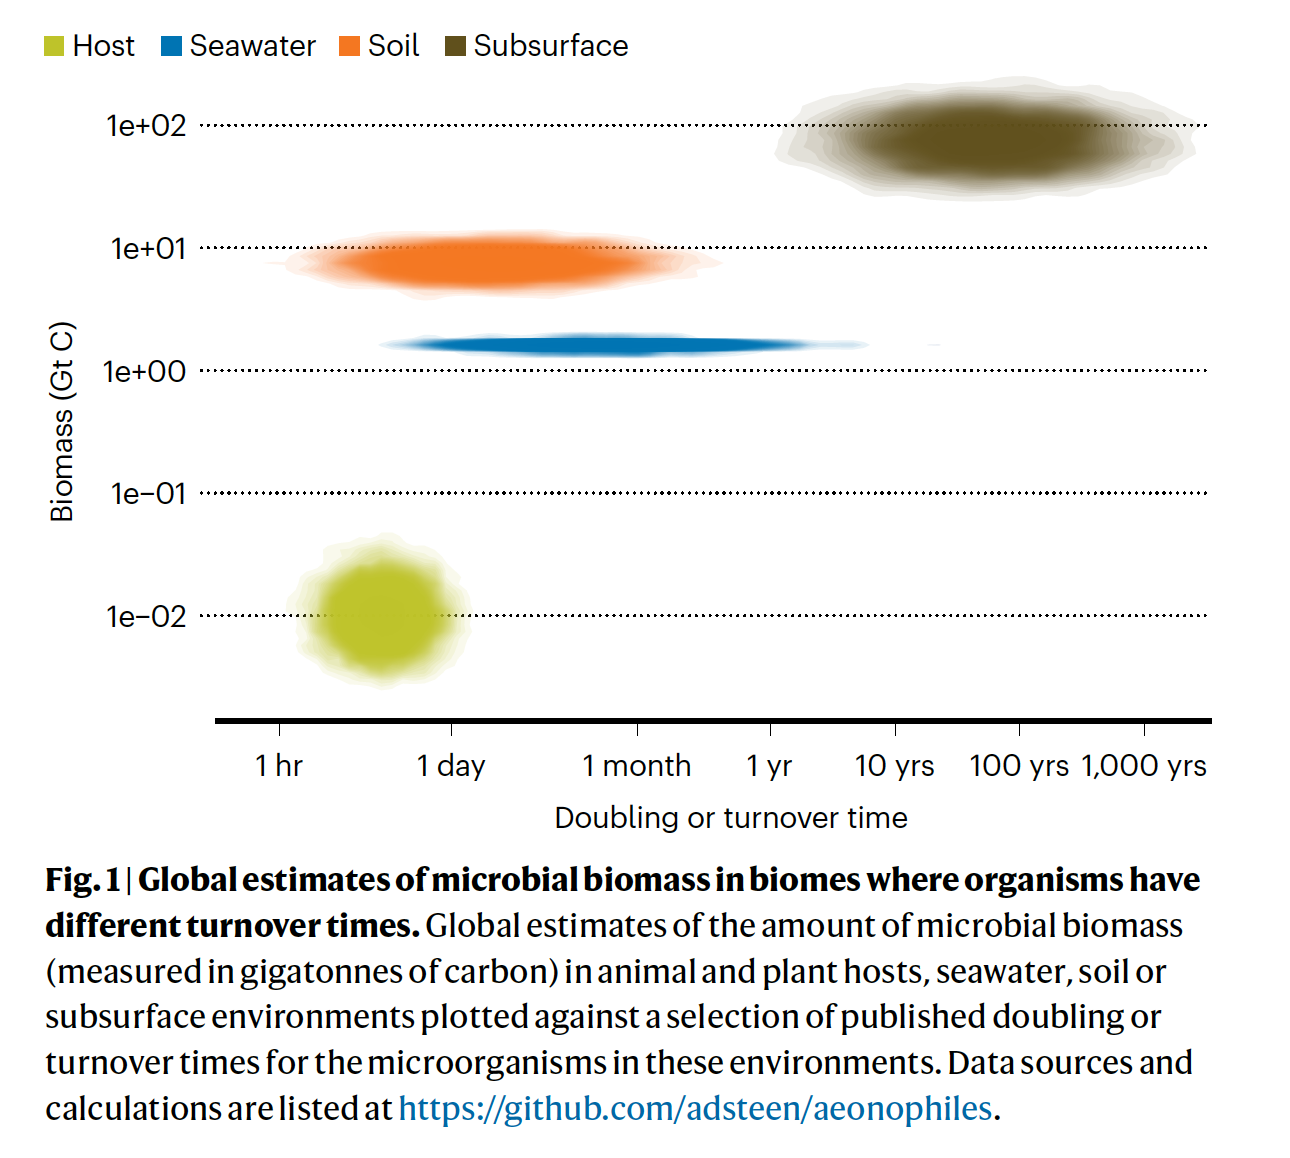
Their ‘generation times’ have been estimated at up to a thousand years. Their existence challenges our understanding of the minimum energy flux necessary to remain alive (that is, the physiological maintenance energy). Lloyd and Steen (2025) recently commented that such organisms represent another class of extremophiles – aenophiles: “species in which all cells are obligated to grow slowly for many years or longer.”
I want to delve into maintenance energy more deeply – it is a concept that seems intuititive but the literature (on cultures) is rather fraught with different mathematical derivations and meanings. Furthermore, the calculations made upon natural populations of aenophiles would suggest maintenance energy rates <1/100th of that measured in most cultures.
Relatively slow growth
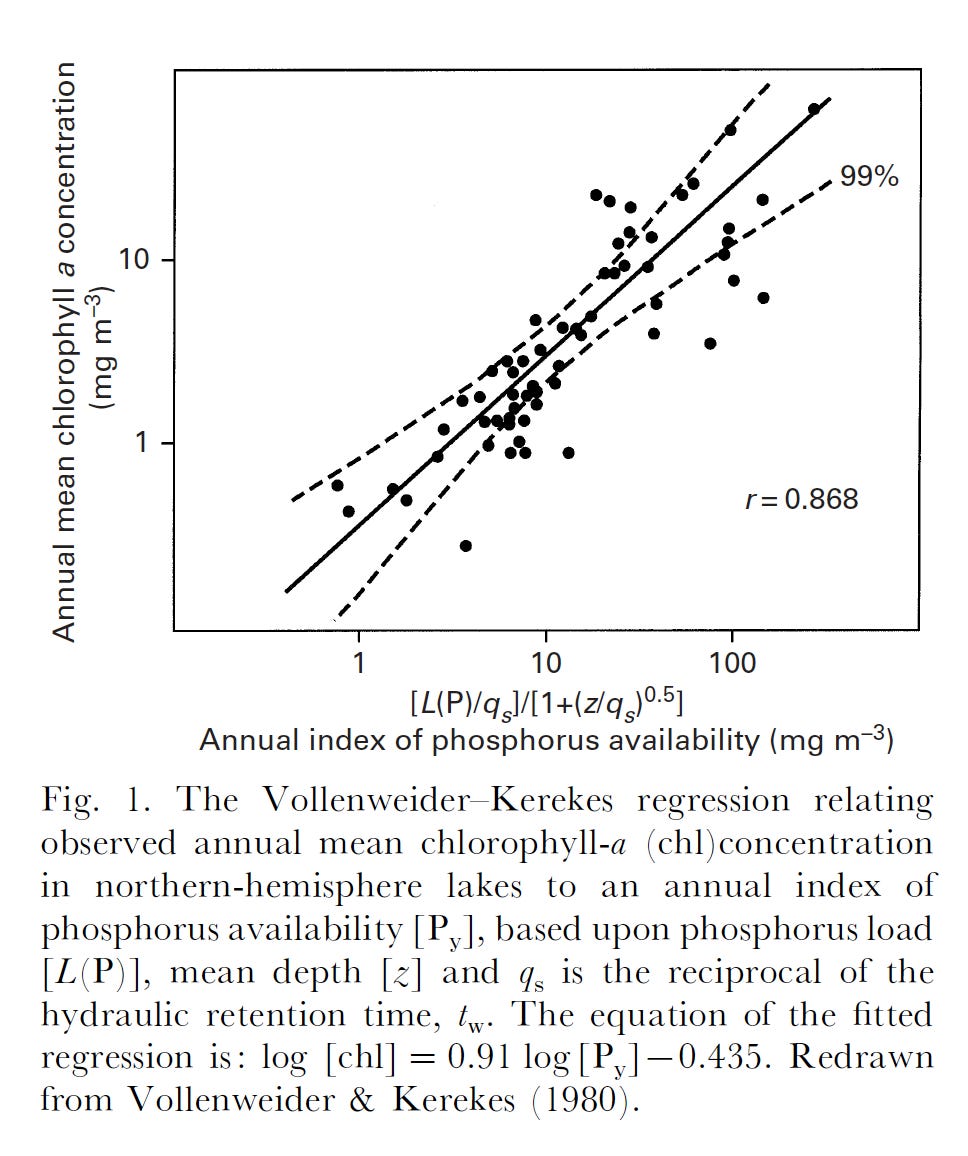
Before that, I would like to point out that almost all microbes grow ‘slow’ in their natural environments – that is, at a rate that is well below the maximum they can achieve (µmax). Viz. Escherichia coli can double in under an hour (µmax ~ 0.7 h-1) under anaerobic conditions – its in situ growth rate is estimated at 5-10% of that. Relatively slow growth is (generally) inevitable and a consequence of nutrient resource use and depletion by the microbial population. There are two facets to the concept of resource limitation in nature. One is a limit on ‘standing crop’ of biomass, determined by the resource in shortest supply. In phytoplankton, the atomic ratio of C:N:P was found to be 106:16:1. Richard Vollenweider demonstrated that it is the loading of phosphorus into freshwater lakes that usually limits phytoplankton biomass.
The second facet is that as microbes grow and deplete the ultimate limiting resource, its concentration will precipitously drop to one that can no longer sustain µmax. This relationship was described by Jacques Monod:
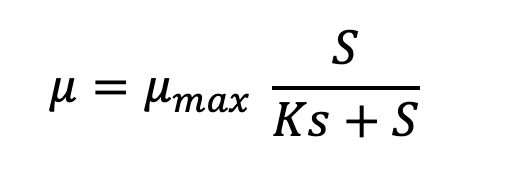
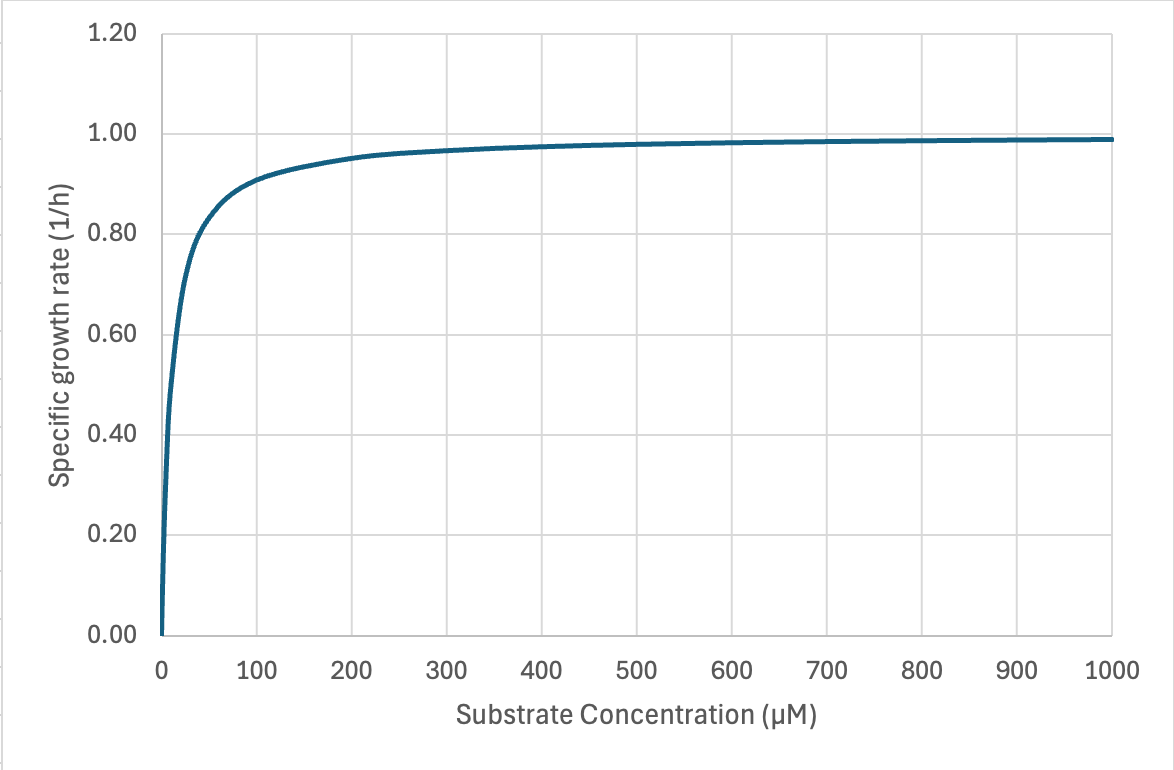
Microbes’ high affinities for limiting substrate often challenge analytical chemists’ ability to measure the concentration at which µ = ½ µmax. Not many values have been reported but in chemostat cultures they range from low micromolar to even nanomolar concentrations. In situ concentrations of individual amino acids in open ocean and lake water range from ~10-100 nM and individual saccharides at 5-50 nM -- these should depress in situ growth rates far below their maximum. Most estimates of doubling times for chemoheterotrophs in aquatic ecosystems cluster in the range of 18–50 h (Staley and Konopka 1985 ; Smith and Prairie 2004). But the case of the most abundant marine chemoheterotroph Pelagibacter ubique may be a counterexample. Its µmax on different substrates is <0.4 d-1 (doubling time > 40 h) and it has very high affinity transporters (Ks = 1 nM for glycine betaine).
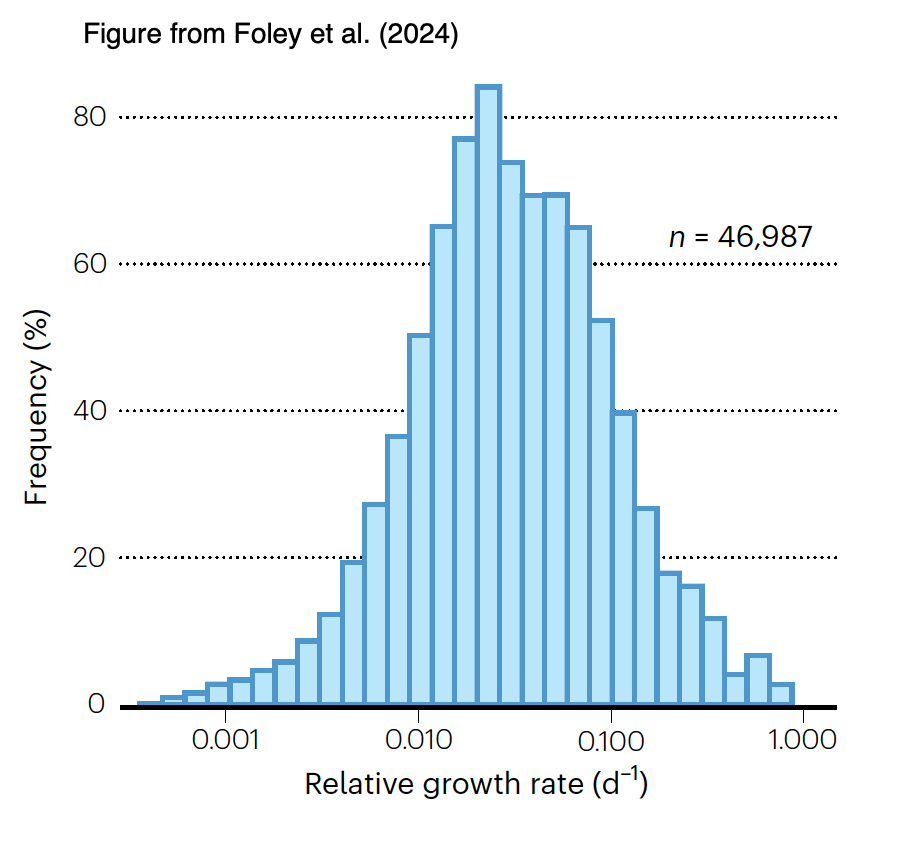
There had been sparser data for in situ growth rates of microbes in soils, but the advent of stable isotope probing with H218O followed by measurement of isotope content and 16S rDNA gene copy number in labeled DNA (Koch et al., 2018) has provided a means to measure these. The bulk of taxon-specific growth rates fall between 0.01 and 0.1 d-1 (i.e., generation times between 7 and 70 d). As it seems likely that many of these taxa will have µmax > 2 d-1 they are growing relatively slowly in nature.
Approaching zero growth rate
“Maintenance energy” entered the microbiological lexicon during the first phase of continuous culture work beginning in the 1960s. However the mathematics and empirical determination really measure “energy substrate not used for growth.” This might include energy dissipation processes that one would not deem ‘physiological’ maintenance. AH Stouthamer (1990) was the first to think about the reactions involved in maintenance. These include:
Ion leaks through the cytoplasmic membrane [e.g., proton leakage dissipating proton motive force]
Macromolecular housekeeping: proofreading, chaperonin refolding & resynthesizing molecules that have been damaged
Cell motility
Defense against O2 stress.
[Obviously #3 and #4 may not operate in all organisms or under all conditions.]
The original mathematical formulations for maintenance presumed that it was a constant across conditions. However if one looks at the processes involved, this is unrealistic. Measuring the actual energy consumption rates by each process is quite difficult. However, it was an advance to think of maintenance energy in thermodynamic terms (Tijhuis et al. 1993) rather than as a debit in substrate consumption or growth rate. In this way, one can calculate a basal power requirement, which Hoehler and Jorgensen (2013) proposed as a clearer term than maintenance.
The ’slowest’ growth of cultures is generated not in chemostats but in biomass recycle fermenters / retentostats, where “near zero” growth rates have been generated. The most relevant work to the deep subsurface anoxic sediments that have extraordinarily low metabolic rates are experiments with Geobacter metallireducens (Lin et al., 2009). From their analysis of maintenance energy consumption, I calculate a power of 5 X 10-16 watts per cell. The basal power requirements derived from retentostat cultures tend to be 10-100 fold less than those found from classical analyses of chemostat cultures. But the stunning result is that these values are ~100-fold larger than power consumption for cells in sulfate-reducing deep subsurface sediments and 1000-fold greater than in methanogenic sediments! The G. metalliruducens cells had ~6X larger cell mass than subsurface microbes – this is relevant as smaller cells will have a lower basal power requirement and can function at lower external substrate concentrations. However, the very large disparity between retentostat culture and in situ measurements suggests there may be something fundamentally different in cells existing at power rates of 10-19- 10-20 watts per cell.
Those calculations come from rates of terminal electron acceptor (sulfate) reduction in sediment incubations (Jaussi et al., 2023) or rates of particular organic C decreases with depth (Bradley et al., 2020) in those sediments (which of course is a proxy for time). Rates were then normalized to direct microscopic counts or qPCR of 16S rDNA genes to arrive at a power per cell value. Implicit in this approach is that all cells are metabolically active. The authors have several rationales for this and believe that few cells are dormant or quiescent, but in general these are indirect and hence more direct data would be welcome. The dataset most on point is Morono et al. (2020). When they added 13C-acetate or a 13C-15N amino acid mixture to sediments that were 95 million years old, ~90% of cells were found to have significant labeling as assayed by NanoSIMS after 21 days incubation. [Note that these were oxic sediments.]
The sense of researchers into the deep subsurface is that “such observations are consistent with a deep biosphere inhabited by cells that are not dormant or dead but that instead subsist in a viable state with extremely low metabolic rate” (Hoehler and Jorgensen, 2013).
How can they do that?
The challenges that emanate for the deep subsurface microbes and the microbial physiological ecologists who study them are many. The current thoughts are that the generation times of these microbes range from years to thousands of years. Almost all the energy they can generate must go to satisfy a basal power requirement consumed for ion gradient maintenance and macromolecular housekeeping.
Jorgensen and Marshall (2016) proposed some adaptations to minimize energy losses due to dissipation of the proton motive force. Lipids with longer fatty acid chains would be less susceptible to passive diffusion of protons across the membrane. Membrane-bound ATP synthetases driven by Na+ rather than H+ ion gradients are advantageous as the former’s transmembrane permeability as >100-fold less.
However, Kempes et al. (2017) analysis suggests that macromolecular housekeeping, particularly repairing protein damage is the largest fraction of the basal power requirement. Here is some highly speculative back-of-the-envelope math on the scale at which this might be a factor.
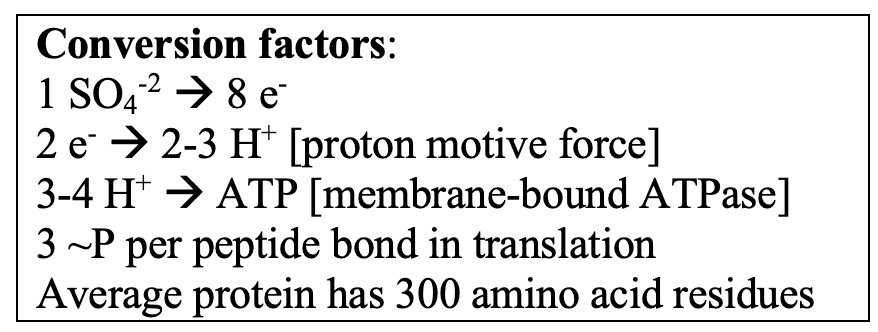
Subsurface cells have a volume of ~0.1 µm-3 – if they are 50% protein, this would translate to ~300K proteins of “average” MW of 30,000 Daltons. The ‘best’ data I could find on protein degradation rates were in Escherichia coli pulse-labeled with stable isotopes (Gupta et al., 2024). They did an analysis under a carbon/energy limitation at ~15% of maximum growth rate. About 16% of the proteins had half-lives < 4 h. It is of course difficult to know how to extrapolate this to very slow growing cells (it would be a great experiment with a retentostat culture!). However, given Hoehler and Jorgensen’s estimate that sulfate-reducing bacteria in the deep subsurface process 1 sulphate ion per cell per second, resynthesis of ~50,000 proteins (@ 3 high-energy phosphate bonds per peptide bond) would require 6 months’ worth of energy derived from sulfate reduction.
As long as I am talking about ~P’s … there are two other potential energy sinks in macromolecular housekeeping. Proteins may become misfolded – chaperonins can correct this but at a cost of ATP (although probably 1000X less than resynthesizing the protein). Many species grown at a low relative rate contain elevated quantities of the ‘alarmone’ ppGpp. It’s effects include a reduction in protein synthesis not only by inhibiting ribosome biogenesis but also the activity of translation elongation and initiation factors. The half-life of ppGpp is thought to be relatively short and its synthesis involves ATP and GTP -- it would be of interest to know whether this regulatory scheme operates in deep subsurface microbes as it might have a high metabolic cost.
Summing up
I really enjoyed digging into the literature on deep subsurface microbes. There are tremendous technical challenges – obtaining uncompromised sediment samples and measuring chemicals, microbes and microbial activity in excruciatingly small amounts. The cohort of scientists who have been working in this area have done an exemplary job of carrying out meticulous and thoughtful research.
But of course much remains to be resolved – what they have uncovered asks fundamental questions about the minimum requirements for life to persist and the stability of the functional macromolecules microbes contain. As several of them have noted, it would be useful to have laboratory systems that approximate the conditions in the deep subsurface. Either retentostats or small microfluidic devices would appear to offer the best options at present. There have been successes in isolating fermentative bacteria from deep aquifers associated with oil or natural gas deposits – if these bear relationship to similar taxa identified in molecular surveys of energy-limited subsurface sediments they might provide an interesting resource to investigate survival at very low energy fluxes.
References
Bradley JA et al. (2020) Widespread energy limitation to life in global subseafloor sediments.Sci. Adv.6, eaba0697. DOI:10.1126/sciadv.aba0697
Foley, M.M. et al. (2024) Growth rate as a link between microbial diversity and soil biogeochemistry. Nat Ecol Evol 8, 2018–2026. https://doi.org/10.1038/s41559-024-02520-7
Gupta, M. et al. (2024) Global protein turnover quantification in Escherichia coli reveals cytoplasmic recycling under nitrogen limitation. Nat Commun 15, 5890. https://doi.org/10.1038/s41467-024-49920-8
Hoehler, T.and Jørgensen, B. (2013) Microbial life under extreme energy limitation. Nat Rev Microbiol 11, 83–94. https://doi.org/10.1038/nrmicro2939
Jaussi M, Jørgensen BB, Kjeldsen KU, Lomstein BA, Pearce C, Seidenkantz M-S and Røy H (2023) Cell-specific rates of sulfate reduction and fermentation in the sub-seafloor biosphere. Front. Microbiol. 14:1198664. doi: 10.3389/fmicb.2023.1198664
Jørgensen BB and Marshall IP. (2016) Slow Microbial Life in the Seabed. Ann Rev Mar Sci. 8:311-32. doi: 10.1146/annurev-marine-010814-015535.
Kempes CP et al. (2017) Drivers of Bacterial Maintenance and Minimal Energy Requirements. Front. Microbiol. 8:31. doi: 10.3389/fmicb.2017.00031
Koch, BJ et al. (2018)Estimating taxon-specific population dynamics in diverse microbial communities Ecosphere 9 e02090. https://doi.org/10.1002/ecs2.2090
Lin B et al. (2009) How Geobacteraceae may dominate subsurface biodegradation: physiology of Geobacter metallireducens in slow-growth habitat-simulating retentostats. Environm Microbiol 11: 2425-2433. https://doi.org/10.1111/j.1462-2920.2009.01971.x
Lloyd, K.G., Steen, A.D. Defining ultra-slow-growing extremophilic microorganisms as aeonophiles. Nat Microbiol 10: 1555–1557 (2025). https://doi.org/10.1038/s41564-025-02048-x
Morono, Y. et al. (2020). Aerobic microbial life persists in oxic marine sediment as old as 101.5 million years. Nat Commun 11: 3626. https://doi.org/10.1038/s41467-020-17330-1
Smith EM , Prairie YT (2004) Bacterial metabolism and growth efficiency in lakes: the importance of phosphorus availability . Limnol Oceanogr 49: 137-147
Staley JT , Konopka A (1985) Measurement of insitu activities of nonphotosynthetic microorganisms in aquatic and terrestrial habitats . Annual Rev Microbiol 39 : 321 – 346
Stouthamer AH (1990) Energetics of growth at low growth rates and its relevance for the maintenance concept. In Microbial Growth Dynamics: Special Publications Of The Society For General Microbiology 28: 85-102.
Tijhuis L et al. (1993) A thermodynamically based correlation for maintenance gibbs energy requirements in aerobic and anaerobic chemotrophic growth. Biotech Bioeng 42: 509-519. https://doi.org/10.1002/bit.260420415
Your moment of Zen
Aberdeen WA bridgework

Excellent post, Allan!
I disagree with the term "aenophile" in that we don't know (and cannot test) if these are obligately bound to slow growth. We showed in Orsi et al 2021 that subsurface Thalassospira grow quite rapidly in the lab. How many other taxa would grow rapidly in the lab given the chance?
It's a shame we never got our experiments up and running to test some of the concepts you discuss here. (though the reason why is proving to be worthwhile)